PROJECTS
Graphic Design Work

Fashion Show Poster

Christmas Campaign

Creative Illustration

College Event Poster

Coffee Shop Poster

Coffee Shop Visiting Card
×
![]()
PROJECTS
Fashion Show Poster
Christmas Campaign
Creative Illustration
College Event Poster
Coffee Shop Poster
Coffee Shop Visiting Card
PROJECTS
A console-based application built using C to manage student records including adding, updating, deleting, and viewing data using file handling.

Click below to explore the implementation
#include <stdio.h>
#include <stdlib.h>
#include <string.h>

struct Student {
    int id;
    char name[50];
    float marks;
};

void addStudent() {
    FILE *fp = fopen("students.txt", "ab");
    struct Student s;

    printf("Enter ID: ");
    scanf("%d", &s.id);
    printf("Enter Name: ");
    scanf(" %[^\n]", s.name);
    printf("Enter Marks: ");
    scanf("%f", &s.marks);

    fwrite(&s, sizeof(s), 1, fp);
    fclose(fp);

    printf("Student added successfully!\\n");
}

void viewStudents() {
    FILE *fp = fopen("students.txt", "rb");
    struct Student s;

    printf("\\n--- Student List ---\\n");

    while (fread(&s, sizeof(s), 1, fp)) {
        printf("ID: %d | Name: %s | Marks: %.2f\\n", s.id, s.name, s.marks);
    }

    fclose(fp);
}

void searchStudent() {
    FILE *fp = fopen("students.txt", "rb");
    struct Student s;
    int id, found = 0;

    printf("Enter ID to search: ");
    scanf("%d", &id);

    while (fread(&s, sizeof(s), 1, fp)) {
        if (s.id == id) {
            printf("Found: %s | Marks: %.2f\\n", s.name, s.marks);
            found = 1;
        }
    }

    if (!found) printf("Student not found!\\n");

    fclose(fp);
}

void deleteStudent() {
    FILE *fp = fopen("students.txt", "rb");
    FILE *temp = fopen("temp.txt", "wb");

    struct Student s;
    int id;

    printf("Enter ID to delete: ");
    scanf("%d", &id);

    while (fread(&s, sizeof(s), 1, fp)) {
        if (s.id != id) {
            fwrite(&s, sizeof(s), 1, temp);
        }
    }

    fclose(fp);
    fclose(temp);

    remove("students.txt");
    rename("temp.txt", "students.txt");

    printf("Deleted successfully!\\n");
}

int main() {
    int choice;

    do {
        printf("\\n1. Add Student\\n2. View Students\\n3. Search\\n4. Delete\\n5. Exit\\n");
        printf("Enter choice: ");
        scanf("%d", &choice);

        switch (choice) {
            case 1: addStudent(); break;
            case 2: viewStudents(); break;
            case 3: searchStudent(); break;
            case 4: deleteStudent(); break;
            case 5: printf("Exiting...\\n"); break;
            default: printf("Invalid choice!\\n");
        }

    } while (choice != 5);

    return 0;
}
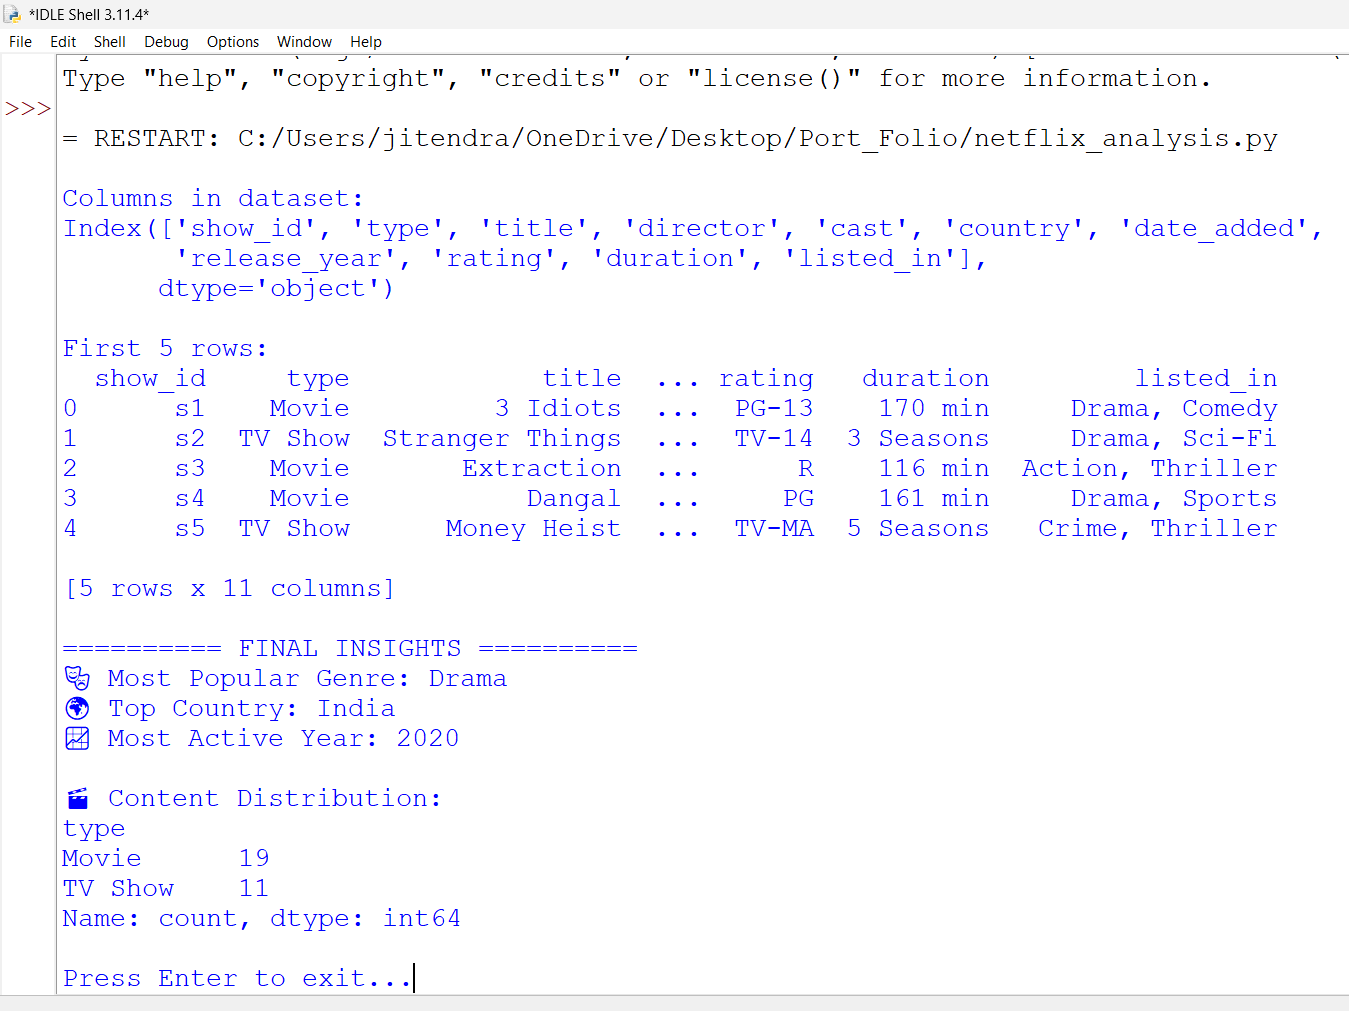
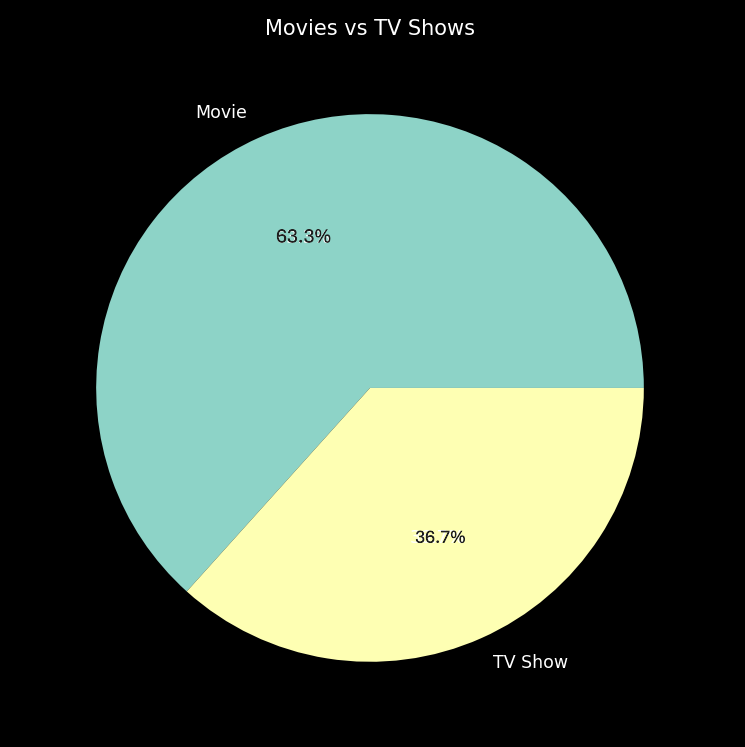
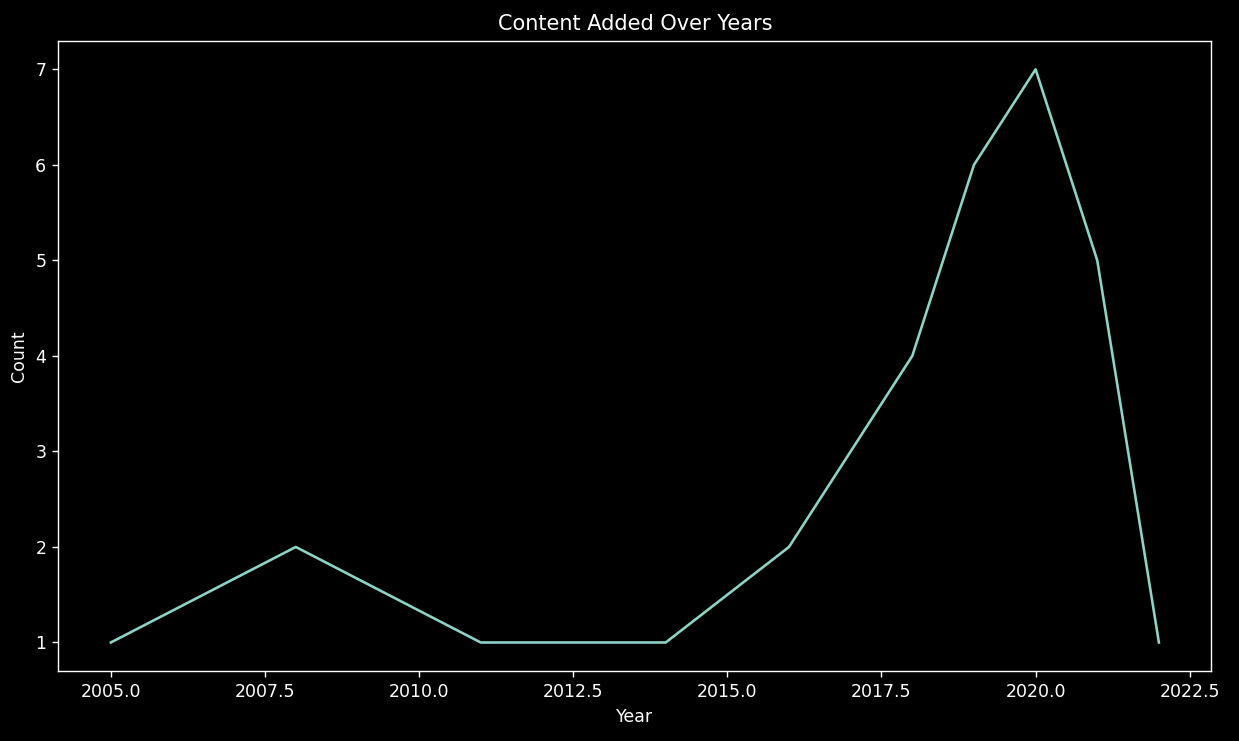
A data analysis project using Python to explore Netflix content trends including genres, country distribution, and content growth over time. Built using Pandas and Matplotlib with a Netflix-style visualization theme.
Click below to explore the implementation
# Import Libraries
import pandas as pd
import matplotlib.pyplot as plt
import seaborn as sns

# -----------------------------
# LOAD DATASET (ROBUST VERSION)
# -----------------------------
df = pd.read_csv("netflix_titles.csv", engine="python")

# Clean column names (IMPORTANT FIX)
df.columns = df.columns.str.strip().str.lower()

print("\nColumns in dataset:")
print(df.columns)

print("\nFirst 5 rows:")
print(df.head())

# -----------------------------
# HANDLE COLUMN NAME ISSUES
# -----------------------------

# Rename columns if needed (safety)
column_map = {
    'listed_in': 'listed_in',
    'type': 'type',
    'country': 'country',
    'date_added': 'date_added',
    'rating': 'rating',
    'duration': 'duration'
}

# Ensure required columns exist
for col in column_map:
    if col not in df.columns:
        print(f" Column '{col}' not found in dataset!")

# -----------------------------
# DATA CLEANING
# -----------------------------

# Use safe fill (won't crash)
if 'country' in df.columns:
    df['country'].fillna('Unknown', inplace=True)

if 'rating' in df.columns:
    df['rating'].fillna('Not Rated', inplace=True)

if 'duration' in df.columns:
    df['duration'].fillna('0', inplace=True)

# Convert date safely
if 'date_added' in df.columns:
    df['date_added'] = pd.to_datetime(df['date_added'], errors='coerce')
    df['year_added'] = df['date_added'].dt.year

# -----------------------------
# GENRE PROCESSING (BEST METHOD)
# -----------------------------
if 'listed_in' in df.columns:
    genre_list = df['listed_in'].str.split(',').explode().str.strip()
else:
    genre_list = pd.Series()

# -----------------------------
# SHOW INSIGHTS FIRST (IMPORTANT)
# -----------------------------
print("\n========== FINAL INSIGHTS ==========")

if not genre_list.empty:
    print(" Most Popular Genre:", genre_list.value_counts().idxmax())

if 'country' in df.columns:
    print(" Top Country:", df['country'].value_counts().idxmax())

if 'year_added' in df.columns:
    print(" Most Active Year:", df['year_added'].value_counts().idxmax())

if 'type' in df.columns:
    print("\n Content Distribution:")
    print(df['type'].value_counts())

# -----------------------------
# GRAPH SETTINGS
# -----------------------------
plt.style.use('dark_background')

# -----------------------------
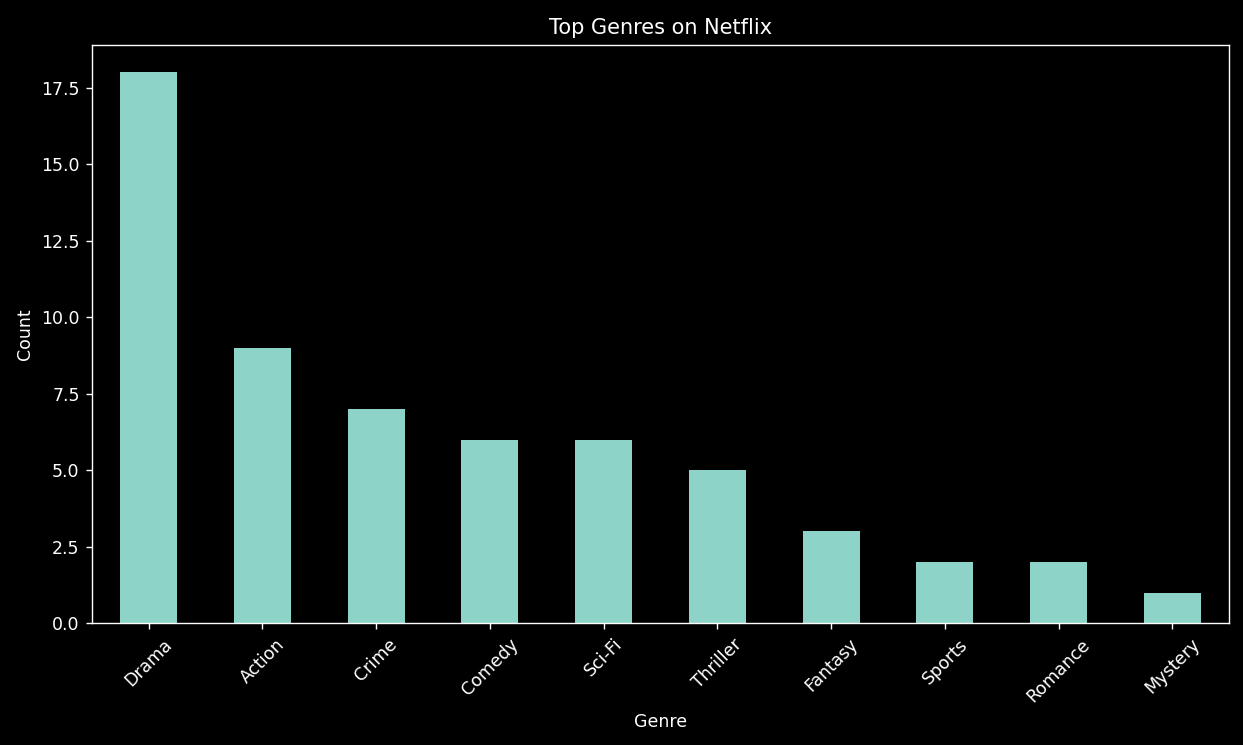
# 1. GENRE GRAPH
# -----------------------------
if not genre_list.empty:
    plt.figure(figsize=(10,6))
    genre_list.value_counts().head(10).plot(kind='bar')
    plt.title("Top Genres on Netflix")
    plt.xlabel("Genre")
    plt.ylabel("Count")
    plt.xticks(rotation=45)
    plt.tight_layout()
    plt.show()

# -----------------------------
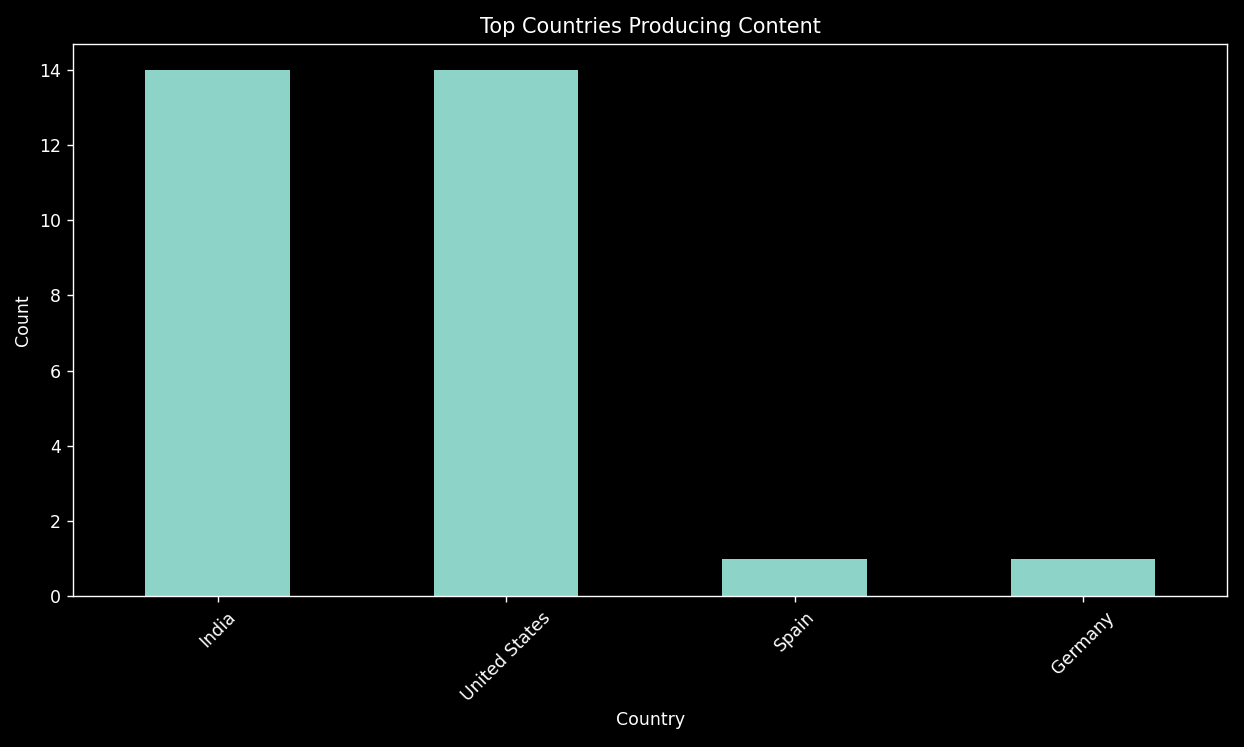
# 2. COUNTRY GRAPH
# -----------------------------
if 'country' in df.columns:
    plt.figure(figsize=(10,6))
    df['country'].value_counts().head(10).plot(kind='bar')
    plt.title("Top Countries Producing Content")
    plt.xlabel("Country")
    plt.ylabel("Count")
    plt.xticks(rotation=45)
    plt.tight_layout()
    plt.show()
# -----------------------------
# 3. TREND GRAPH
# -----------------------------
if 'year_added' in df.columns:
    plt.figure(figsize=(10,6))
    df['year_added'].value_counts().sort_index().plot()
    plt.title("Content Added Over Years")
    plt.xlabel("Year")
    plt.ylabel("Count")
    plt.tight_layout()
    plt.show()

# -----------------------------
# 4. PIE CHART
# -----------------------------
if 'type' in df.columns:
    plt.figure(figsize=(6,6))
    df['type'].value_counts().plot(kind='pie', autopct='%1.1f%%')
    plt.title("Movies vs TV Shows")
    plt.ylabel("")
    plt.tight_layout()
    plt.show()
# -----------------------------
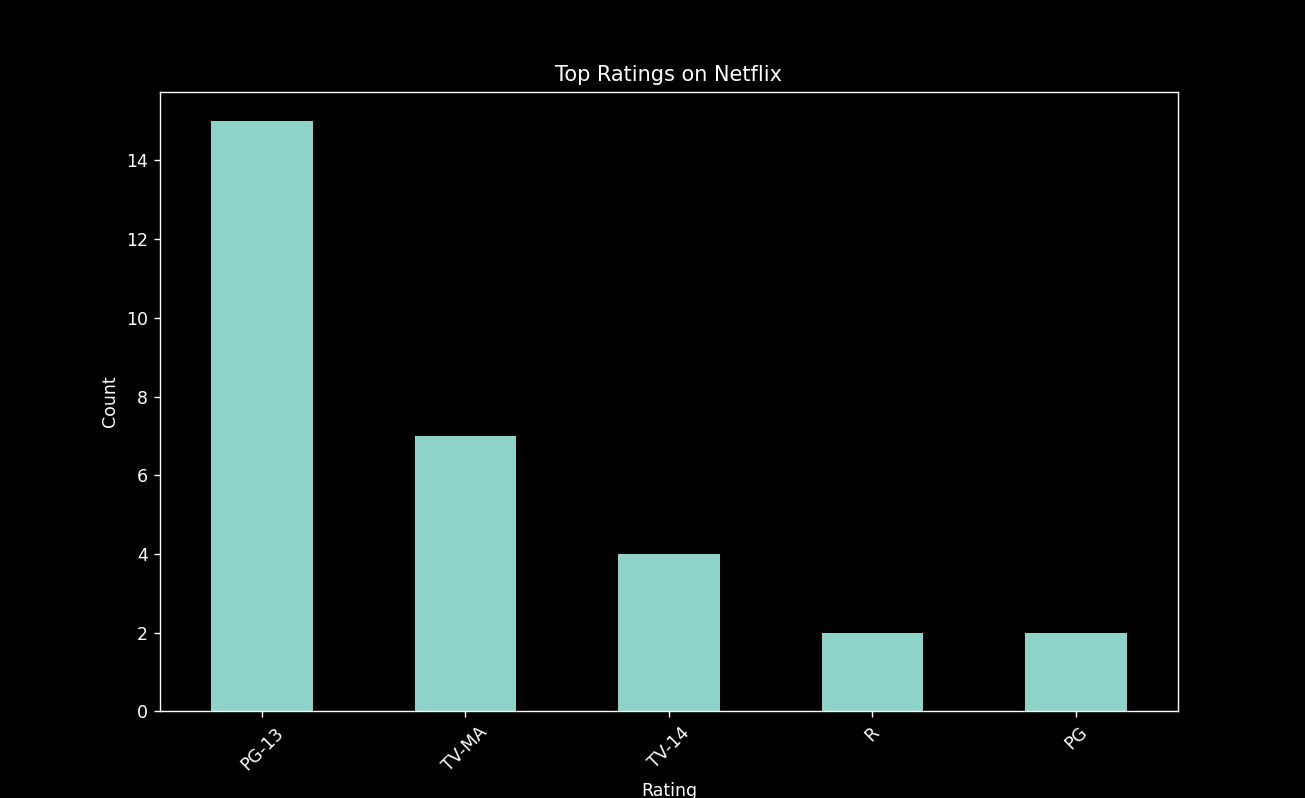
# 5. RATINGS GRAPH
# -----------------------------
if 'rating' in df.columns:
    plt.figure(figsize=(12,8))
    df['rating'].value_counts().head(10).plot(kind='bar')
    plt.title("Top Ratings on Netflix")
    plt.xlabel("Rating")
    plt.ylabel("Count")
    plt.xticks(rotation=45)
    plt.show()

# Keep terminal open
input("\nPress Enter to exit...")